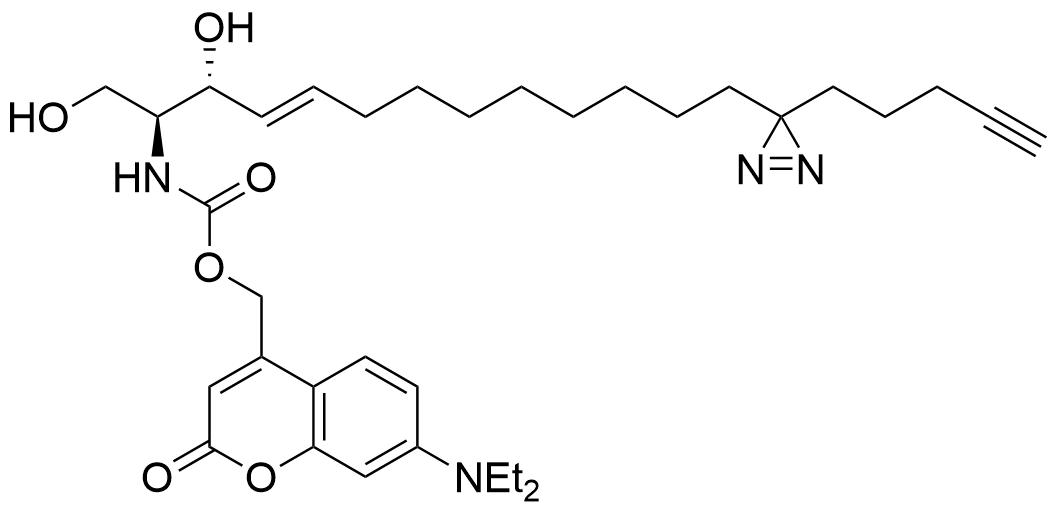
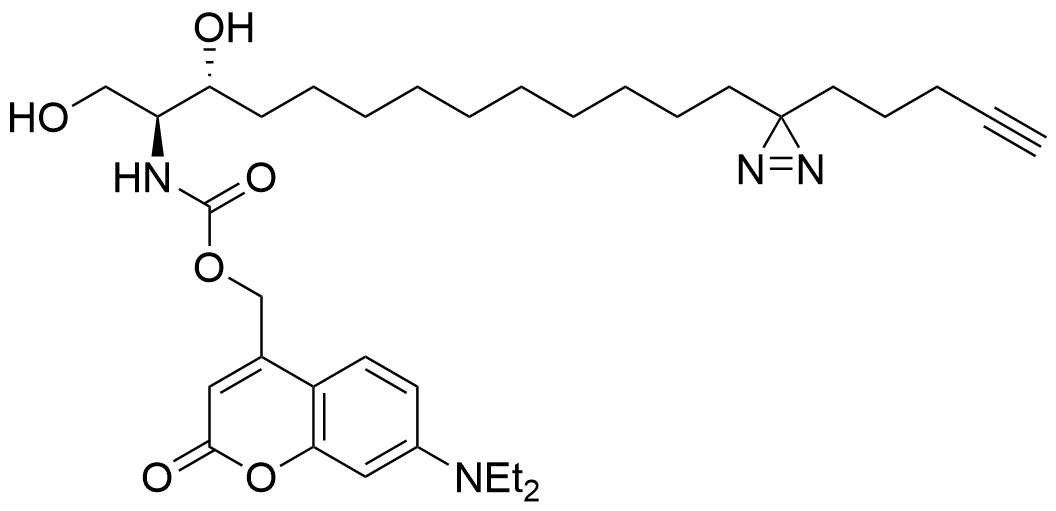
Volcano plots depict the relative enrichment of each protein versus control (x-axis) and the statistical significance of each protein following a Student’s t-test (y-axis, -log10 transformed). The left panel depicts the results of a pulldown using trifunctionalized sphingosine; the right panel depicts the results of the pulldown using trifunctionalized sphinganine. Black proteins are unenriched or depleted in the presence of probe, Purple proteins are enriched to the probe but fall below a FDR or p-value threshold of significance, and Orange proteins surpass the threshold of significance (need details of threshold).
Farley et al. 2024
Trifunctional Sphinganine: A New Tool to Dissect Sphingolipid Function
Journal
ACS Chemical Biology
Abstract
Functions of the sphingolipids sphingosine and sphinganine in cells are not well established. While some signaling roles for sphingosine have been elucidated, the closely related sphinganine has been described only insofar as it does not elicit many of the same signaling responses. The underlying mechanisms behind the cell biological differences between these lipids are not well understood. Here, we prepared multifunctionalized derivatives of the two lipid species that only differ in a single double bond of the carbon backbone. Using these novel probes, we were able to define their spatiotemporal distribution within cells. Furthermore, we used these tools to systematically map the protein interactomes of both lipids. The lipid-protein conjugates, prepared through photo-crosslinking in live cells and extraction via click chemistry to azide beads, revealed significant differences in the captured proteins, highlighting their distinct roles in various cellular processes. This work elucidates mechanistic differences between these critical lipids and sets the foundation for further studies on the functions of sphingosine and sphinganine.
Lipid probes utilized
Cell line analyzed
Uncaging & Crosslinking timeline
Lipid Probe | Uptake time | Uncaging time | Interaction time | Crosslinking time |
---|---|---|---|---|
Sph | 60 min | 5 min | 15 min | 5 min |
Spa | 60 min | 5 min | 15 min | 5 min |
Mass spectrometry quantification method
16-channel Tandem Mass Tagging (TMT16)
Additional sample preparation ?
Data visualization
Ranked-order plots depict the relative enrichment of each protein versus control (y-axis) from lowest to highest. The left panel depicts the results of a pulldown using trifunctionalized sphingosine; the right panel depicts the results of the pulldown using trifunctionalized sphinganine. Black proteins are unenriched or depleted in the presence of probe, Purple proteins are enriched to the probe but fall below a FDR or p-value threshold of significance, and Orange proteins surpass the threshold of significance (need details of threshold).
MA plots depict the average abundance of each protein in the crosslinked and uncrosslinked conditions (x-axis) versus the log2-transformed fold-change between the crosslinked and uncrosslinked conditions (y-axis). The left panel depicts the results of a pulldown using trifunctionalized sphingosine; the right panel depicts the results of the pulldown using trifunctionalized sphinganine. Black proteins are unenriched or depleted in the presence of probe, Purple enriched candidates are defined as proteins with a false discovery rate less than 0.2 and a fold change of at least 1.5-fold, and Orange enriched hits are defined as proteins with a false discovery rate less than 0.05 and a fold change of at least 2-fold in the +UV over the -UV).
Gene Ontology Analysis
In beta: GO analysis still under development
(No BP pathways identified among enriched hits and candidates.)
Data exploration
Check the boxes below to filter the dataset by which lipid probe was used in the pulldown and by significance thresholds.
This datatable contains all the data plotted above. Check the boxes below to filter the dataset by which lipid probe was used in the pulldown and by significance thresholds. ‘No hit’ proteins are unenriched or depleted in the presence of probe, ‘enriched candidates’ are defined as proteins with a false discovery rate less than 0.2 and a fold change of at least 1.5-fold, and ‘enriched hits’ are defined as proteins with a false discovery rate less than 0.05 and a fold change of at least 2-fold in the +UV over the -UV.