Data as reported in Thomas et al., 2025. Volcano plots depict the relative enrichment of each protein versus non-crosslinked control (x-axis) and the statistical significance of each protein following a Student’s t-test (y-axis, -log10 transformed). Black proteins are unenriched or depleted in the presence of probe, Purple enriched candidates are defined as proteins with a false discovery rate less than 0.2 and a fold change of at least 1.5-fold, and Orange enriched hits are defined as proteins with a false discovery rate less than 0.05 and a fold change of at least 2-fold in the +UV over the -UV.
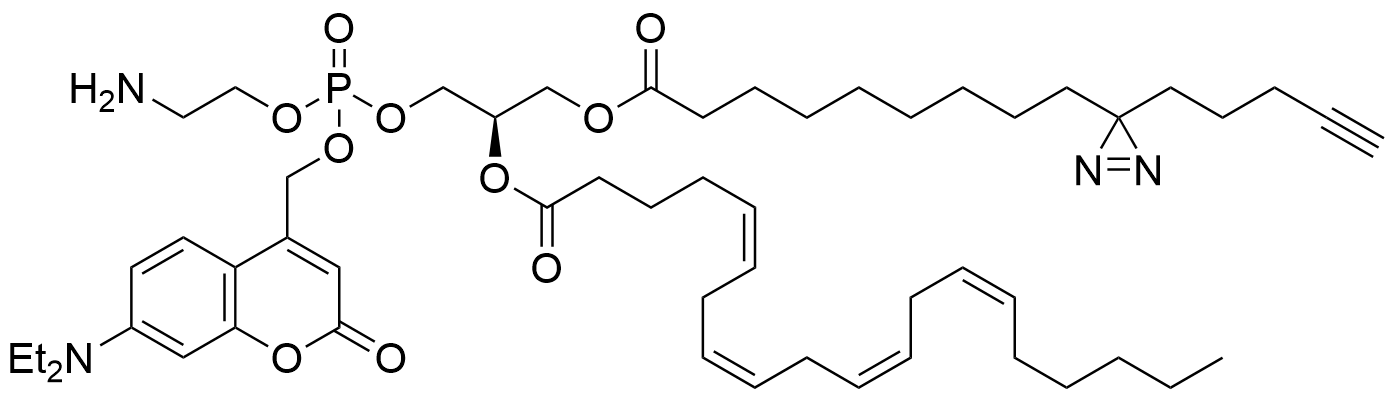
Trifunctional Phosphatidic Acid
Structure
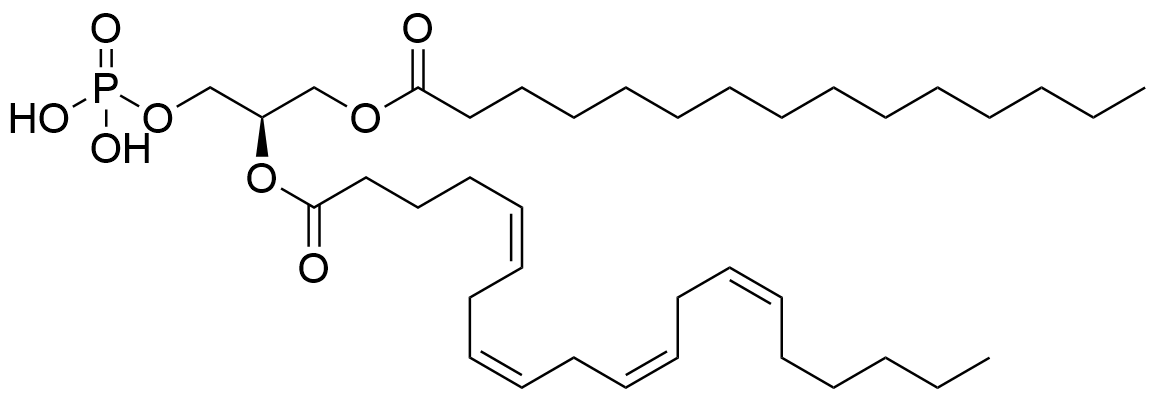
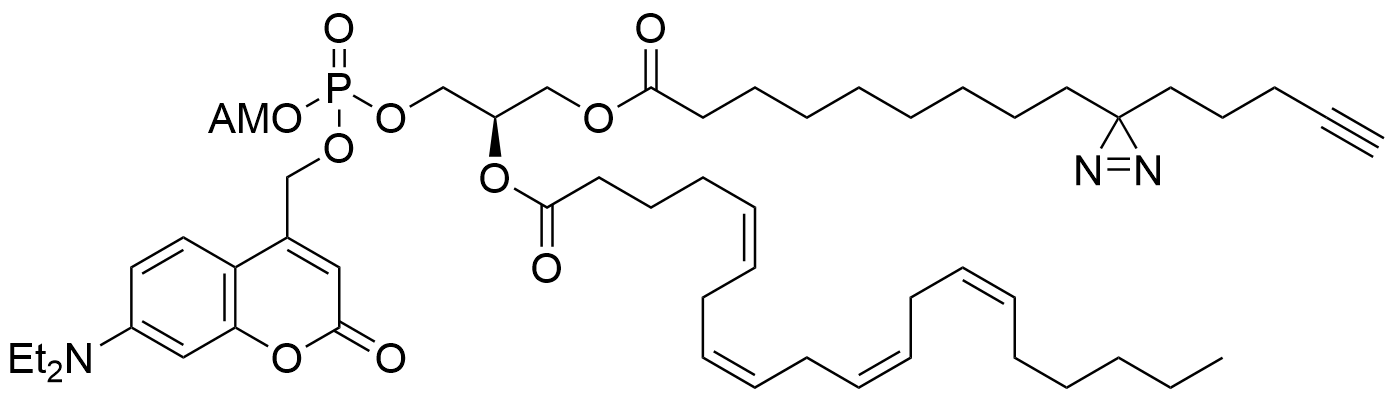
Chemical structures drawn by Berit Blume.
Protein Interactome
Cell background: HeLa
Study details
Journal
Chemical Communications
Abstract
Phosphatidylethanolamine (PE) is a ubiquitous lipid species in higher eukaryotes which resides preferentially in mitochondria. Here, we synthesized a multifunctionalized PE derivative (1) de-signed to identify PE-binding proteins in intact cells through photo-crosslinking and subsequent isolation and proteomic analysis of the PE-protein conjugates. Due to its aromatic caging group, 1 is initially concentrating in perinuclear membranes. After uncaging, rapid translocation to mitochondria was observed. Hence, the tool is useful for tracking PE location and for determining the PE interactome. A trifunctional phosphatidic acid (PA) derivative in compari-son was rapidly metabolized and is hence more limited in its use.
Lipid probes utilized
Cell line analyzed
Species: Homo sapiens
Cell type: Epithelial (immortalized cervical cancer line)
Uncaging & Crosslinking timeline
| Lipid Probe | Uptake time | Uncaging time | Interaction time | Crosslinking time |
|---|---|---|---|---|
| PA | 60 min | 5 min | 15 min | 5 min |
| PE | 60 min | 5 min | 15 min | 5 min |
Mass spectrometry quantification method
16-channel Tandem Mass Tagging (TMT16)
ProteomeXchange details
ProteomeXchange title: Trifunctional lipid derivatives: PE’s mi-tochondrial interactome
ProteomeXchange accession: PXD059960
PubMed ID: Not applicable
Publication DOI: 10.1039/D4CC03599B
Project Webpage: http://www.ebi.ac.uk/pride/archive/projects/PXD059960
FTP Download: https://ftp.pride.ebi.ac.uk/pride/data/archive/2025/01/PXD059960
Additional sample preparation ?
Cell lysates were separated into membrane and cytosolic fractions. This publication reports the results of just the membrane fraction.
Data wrangling
Use the download button below to download the R script used to wrangle the authors’ original submission into the data visualization tools on the Lipid Interactome:
Use the download buttons below to download the original data file prior to wrangling:
Membrane Fraction
Data visualization
Data as reported in Thomas et al., 2025. Ranked-order plots depict the relative enrichment of each protein versus non-crosslinked control (y-axis) from lowest to highest. Black proteins are unenriched or depleted in the presence of probe, Purple enriched candidates are defined as proteins with a false discovery rate less than 0.2 and a fold change of at least 1.5-fold, and Orange enriched hits are defined as proteins with a false discovery rate less than 0.05 and a fold change of at least 2-fold in the +UV over the -UV.
Data as reported in Thomas et al., 2025. MA plots depict the average abundance of each protein in the crosslinked and uncrosslinked conditions (x-axis) versus the log2-transformed fold-change between the crosslinked and uncrosslinked conditions (y-axis). Black proteins are unenriched or depleted in the presence of probe, Purple enriched candidates are defined as proteins with a false discovery rate less than 0.2 and a fold change of at least 1.5-fold, and Orange enriched hits are defined as proteins with a false discovery rate less than 0.05 and a fold change of at least 2-fold in the +UV over the -UV.
Data exploration and download
Check the boxes below to filter the dataset by which lipid probe was used in the pulldown and by significance thresholds.
Cytosolic Fraction
Data visualization
Data as reported in Thomas et al., 2025. Volcano plots depict the relative enrichment of each protein versus non-crosslinked control (x-axis) and the statistical significance of each protein following a Student’s t-test (y-axis, -log10 transformed). Black proteins are unenriched or depleted in the presence of probe, Purple enriched candidates are defined as proteins with a false discovery rate less than 0.2 and a fold change of at least 1.5-fold, and Orange enriched hits are defined as proteins with a false discovery rate less than 0.05 and a fold change of at least 2-fold in the +UV over the -UV.
Data as reported in Thomas et al., 2025. Ranked-order plots depict the relative enrichment of each protein versus non-crosslinked control (y-axis) from lowest to highest. Black proteins are unenriched or depleted in the presence of probe, Purple enriched candidates are defined as proteins with a false discovery rate less than 0.2 and a fold change of at least 1.5-fold, and Orange enriched hits are defined as proteins with a false discovery rate less than 0.05 and a fold change of at least 2-fold in the +UV over the -UV.
Data as reported in Thomas et al., 2025. MA plots depict the average abundance of each protein in the crosslinked and uncrosslinked conditions (x-axis) versus the log2-transformed fold-change between the crosslinked and uncrosslinked conditions (y-axis). Black proteins are unenriched or depleted in the presence of probe, Purple enriched candidates are defined as proteins with a false discovery rate less than 0.2 and a fold change of at least 1.5-fold, and Orange enriched hits are defined as proteins with a false discovery rate less than 0.05 and a fold change of at least 2-fold in the +UV over the -UV.
Data exploration and download
Check the boxes below to filter the dataset by which lipid probe was used in the pulldown and by significance thresholds.