Trifunctional Sphinganine
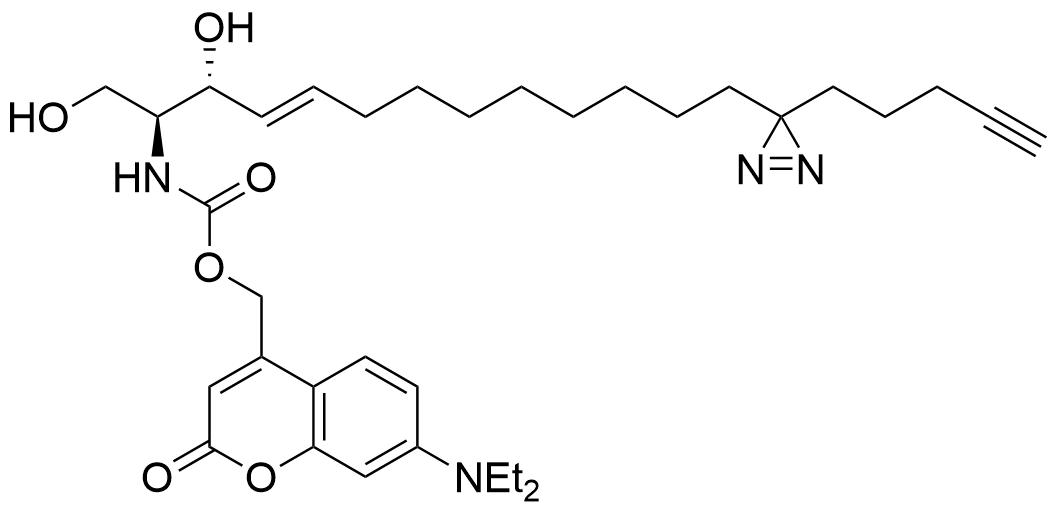
Structure
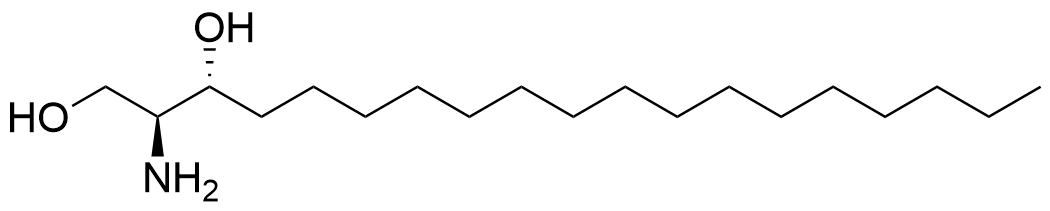
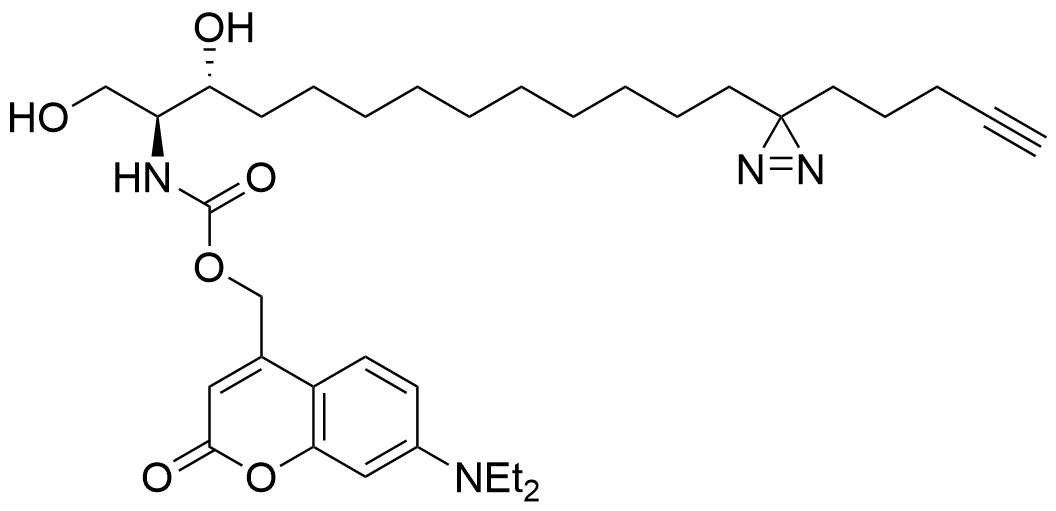
Chemical structures drawn by Berit Blume.
Protein interactome
Journal
ACS Chemical Biology
Abstract
Functions of the sphingolipids sphingosine and sphinganine in cells are not well established. While some signaling roles for sphingosine have been elucidated, the closely related sphinganine has been described only insofar as it does not elicit many of the same signaling responses. The underlying mechanisms behind the cell biological differences between these lipids are not well understood. Here, we prepared multifunctionalized derivatives of the two lipid species that only differ in a single double bond of the carbon backbone. Using these novel probes, we were able to define their spatiotemporal distribution within cells. Furthermore, we used these tools to systematically map the protein interactomes of both lipids. The lipid-protein conjugates, prepared through photo-crosslinking in live cells and extraction via click chemistry to azide beads, revealed significant differences in the captured proteins, highlighting their distinct roles in various cellular processes. This work elucidates mechanistic differences between these critical lipids and sets the foundation for further studies on the functions of sphingosine and sphinganine.
Lipid probes utilized
Cell line analyzed
Species: Homo sapiens
Cell type: hepatocyte derived cellular carcinoma cell
Uncaging & Crosslinking timeline
| Lipid Probe | Uptake time | Uncaging time | Interaction time | Crosslinking time |
|---|---|---|---|---|
| Sph | 60 min | 5 min | 15 min | 5 min |
| Spa | 60 min | 5 min | 15 min | 5 min |
Mass spectrometry quantification method
16-channel Tandem Mass Tagging (TMT16)
Additional sample preparation ?
Data wrangling
Use the download button below to download the R script used to wrangle the authors’ original submission into the data visualization tools on the Lipid Interactome:
Use the download button below to download the original data file prior to wrangling: