Volcano plots depict the relative enrichment of each protein versus non-crosslinked control (x-axis) and the statistical significance of each protein following a Student’s t-test (y-axis, -log10 transformed). Black proteins are designated as not statistically significant. Orange “enriched hit” denotes proteins with fold-changes > 1.5 (logFC > 0.5) pvalue < 0.05. Only proteins identified in all three replicates are displayed.
Phosphatidyl diazirine alkyne alcohol
PDAA
Structure

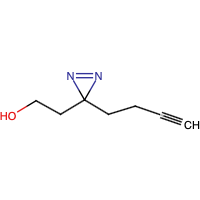
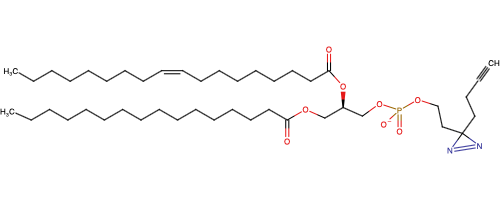
Temporary chemical structures drawn by Gaelen Guzman.
Protein Interactome
Study details
Journal
ACS Chemical Biology
Abstract
Alcohol consumption leads to formation of phosphatidylethanol (PEth) via the transphosphatidylation activity of phospholipase D (PLD) enzymes. Though this non-natural phospholipid routinely serves as a biomarker of chronic alcoholism, its pathophysiological roles remain unknown. We use a minimalist diazirine alkyne alcohol as an ethanol surrogate to generate clickable, photoaffinity lipid reporters of PEth localization and lipid–protein interactions via PLD-mediated transphosphatidylation. We use these tools to visualize phosphatidyl alcohols in a manner compatible with standard permeabilization and immunofluorescence methods. We also use click chemistry tagging, enrichment, and proteomics analysis to define the phosphatidyl alcohol interactome. Our analysis reveals an enrichment of putative interactors at various membrane locations, and we validate one such interaction with the single-pass transmembrane protein basigin/CD147. This study provides a comprehensive view of the molecular interactions of phosphatidyl alcohols with the cellular proteome and points to future work to connect such interactions to potential pathophysiological roles of PEth.
Lipid probes utilized
Cell line analyzed
Species: Homo sapiens
Cell type: Epithelial (immortalized cervical cancer line)
Uncaging & Crosslinking timeline
Mass spectrometry quantification method
PSM
Data wrangling
Use the download button below to download the R script used to wrangle the authors’ original submission into the data visualization tools on the Lipid Interactome:
Use the download button below to download the original data file prior to wrangling:
Data visualization
Data as reported in Yu et al., 2021, 2024. Black proteins are designated as not statistically significant. Orange “enriched hit” denotes proteins with fold-changes > 1.5 (logFC > 0.5) pvalue < 0.05. Only proteins identified in all three replicates are displayed.
Data as reported in Yu et al., 2021. MA plots depict the average abundance of each protein in the crosslinked and uncrosslinked conditions (x-axis) versus the log2-transformed fold-change between the crosslinked and uncrosslinked conditions (y-axis). Black proteins are designated as not statistically significant. Orange “enriched hit” denotes proteins with fold-changes > 1.5 (logFC > 0.5) pvalue < 0.05. Only proteins identified in all three replicates are displayed.
Gene Ontology Analysis
In beta: GO analysis still under development
No enriched molecular functions identified among enriched hits and candidates.
No enriched biological processes identified among enriched hits and candidates.
Data exploration and download
Check the boxes below to filter by significance thresholds.