Volcano plots depict the relative enrichment of each protein versus non-crosslinked control (x-axis, log2 transformed and median normalized) and the statistical significance of each protein following a Student’s t-test (y-axis, -log10 transformed). Black proteins are identified in only one replicate, Purple enriched candidates are defined as proteins identified in two replicates & fold-change > 1.5 (logFC 0.585) & pvalue < 0.01, and Orange enriched hits are defined as proteins identified in all three replicates & fold-change > 1.5 (logFC 0.585) & pvalue < 0.01).
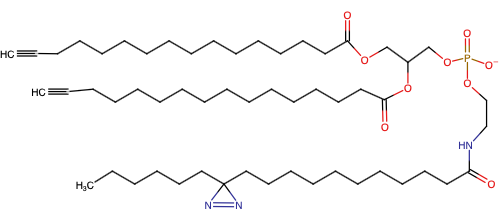
Bifunctional N-Acylphosphatidylethanolamine
NAPE
Structure

Protein Interactome
Cell background: HeLa
Study details
Journal
Journal of the American Chemical Society
Abstract
Most eukaryotic membranes comprise phospholipids bearing two hydrophobic tails, but N-acylphosphatidylethanolamine (NAPE) stands out as a long-known but poorly understood phospholipid with three hydrophobic groups. What little attention NAPE has received has been devoted to understanding its metabolic functions as a precursor to N-acylethanolamine (NAE), a bioactive lipid that acts as an endocannabinoid. Yet, levels of NAPE increase during myocardial infarction and ischemia, suggesting potential signaling roles for this lipid. Here, we exploit photoaffinity labeling (PAL) to identify NAPE-interacting proteins and elucidate signaling functions of NAPE. By positioning diazirine and alkyne groups in metabolically distinct regions of the NAPE molecule, we ensured that our PAL probe reported on interactions of NAPE and not NAE. Our studies identified several NAPE interactors, including two single-pass transmembrane proteins, CD147/Basigin and CD44, both of which serve as chaperones for monocarboxylate transporters (MCTs) from the SLC16A family that mediate lactate flux across the plasma membrane. Functional studies revealed that NAPE stimulates lactate efflux by MCTs dependent upon CD147 and CD44, establishing NAPE as a bona fide signaling lipid and pointing to potential physiological roles in metabolic and energy homeostasis that may be pathologically relevant in ischemia.
Lipid probes utilized
Cell line analyzed
Species: Homo sapiens
Cell type: Epithelial (immortalized cervical cancer line)
Uncaging & Crosslinking timeline
| Lipid Probe | Uptake time | Interaction time | Crosslinking time | |
|---|---|---|---|---|
| LEI-401 | 30 min | 60 min | 30 min |
Mass spectrometry quantification method
SILAC
Additional sample preparation ?
None
Lipid interactomics data analysis
Data as submitted by the original authors was not normalized. To make these results more similar to the other datasets presented here, we performed median normalization to center the distribution around a logFC value of 0 (see the R file below for wrangling). We also needed to do an Ensemble query to find the gene names for the accession numbers of proteins identified in this dataset.
Data wrangling
Use the download button below to download the R script used to wrangle the authors’ original submission into the data visualization tools on the Lipid Interactome:
Use the download button below to download the original data file prior to wrangling:
Data visualization
Ranked-order plots depict the relative enrichment of each protein versus non-crosslinked control (y-axis) from lowest to highest. Black proteins are identified in only one replicate, Purple enriched candidates are defined as proteins identified in two replicates & fold-change > 1.5 (logFC 0.585) & pvalue < 0.01, and Orange enriched hits are defined as proteins identified in all three replicates & fold-change > 1.5 (logFC 0.585) & pvalue < 0.01).
MA plots depict the average abundance of each protein in the crosslinked and uncrosslinked conditions (x-axis) versus the log2-transformed fold-change between the crosslinked and uncrosslinked conditions (y-axis). Black proteins are identified in only one replicate, Purple enriched candidates are defined as proteins identified in two replicates & fold-change > 1.5 (logFC 0.585) & pvalue < 0.01, and Orange enriched hits are defined as proteins identified in all three replicates & fold-change > 1.5 (logFC 0.585) & pvalue < 0.01).
Data exploration and download
This datatable contains all the data plotted above. Check the boxes below to filter the dataset by which lipid probe was used in the pulldown and by significance thresholds. logFC ratios are median normalized. "Num Replicate IDs" denotes the number of replicates in which the protein was identified. As above, "enriched hit" denotes proteins identified in all three replicates & fold-change > 1.5 (logFC 0.585) & pvalue < 0.01. "enriched candidates" are proteins identified in two replicates & fold-change > 1.5 (logFC 0.585) & pvalue < 0.01.